
Q2 2026 ICI Land and Industrial Report
Market Overview
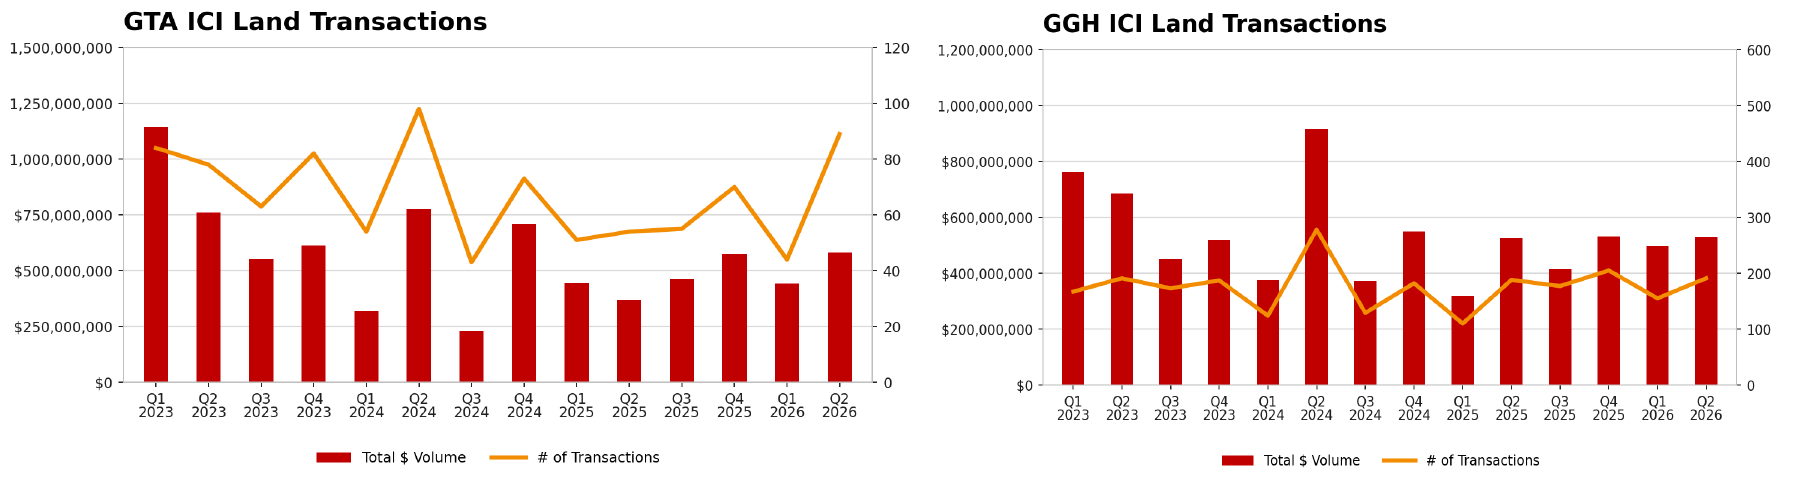
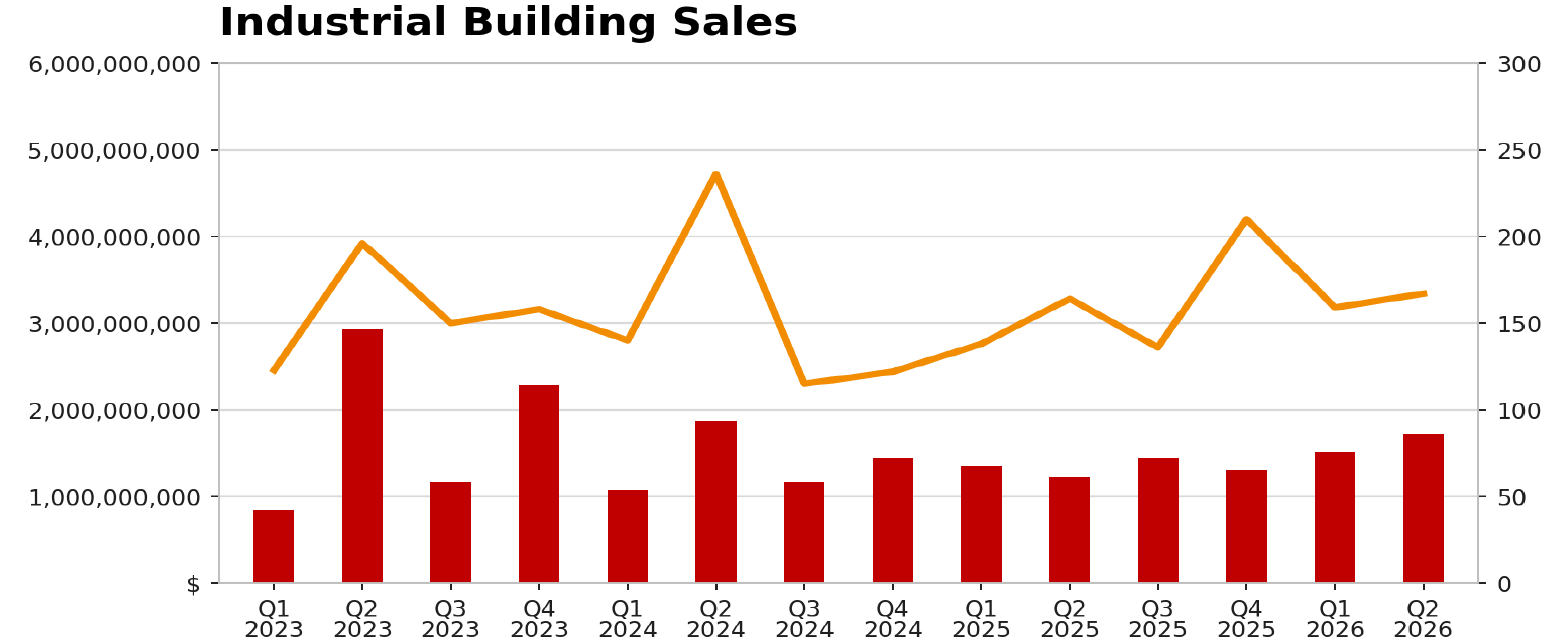
The ICI market improved meaningfully in Q2 2026. GTA ICI land sales reached $581.6 million across 89 transactions, up 31% from Q1 2026 and 57% year over year. GGH sales held steady at $530.1 million across 191 transactions, while industrial building sales rose to $1.72 billion, the highest quarterly total in two years.
What Is Driving Demand
Strategic corporate end-users and institutional developers acquired greenfield sites ahead of the Canada-United States-Mexico Agreement (CUSMA) joint review scheduled to begin July 1, 2026. Occupiers are shifting from "just-in-time" supply chains toward "just-in-case" domestic warehousing to manage trade policy and logistics uncertainty. Greenfield land values have adjusted from peak pricing in peripheral submarkets, while prime infill redevelopment sites continue to command premium valuations.
Market Performance
Vacancy tightened, leasing remained positive and asking rents stabilized near $16.00 to $16.50 per square foot. GTA industrial availability plateaued, supported by a fourth consecutive quarter of positive net absorption, and the construction pipeline continued to moderate.
Regional Trends and Notable Transactions
Activity was concentrated in Halton Hills, Oakville, Mississauga and Caledon, with buyers including owner-users, developers, technology firms, logistics operators and institutional investors. The largest GTA transaction was 10862 Steeles Avenue East in Halton Hills (25 acres, $49.9 million), followed by 3480 Ninth Line in Oakville (4.3 acres, $24.0 million). In the GGH, 1209 Waterloo Street in Wilmot led activity (92.2 acres, $38.8 million).
A Widening Valuation Gap
A clear bid-ask gap has emerged between developers, who are constrained by construction costs and target returns, and end-users buying for long-term operational needs. Land prices appear to be nearing a floor and many developers remain on the sidelines. We expect activity in the second half of 2026 to be led by end-users.
Policy Context
Provincial policy in the quarter centred on protecting tariff-exposed manufacturers and rewarding investment in domestic processing capacity. The Ontario Made Manufacturing Investment Tax Credit has been enhanced to 15%, with a maximum credit of $3 million per year on eligible expenditures of up to $20 million. The 2026 Ontario Budget added $100 million to the Ontario Together Trade Fund and cut the small business corporate income tax rate from 3.2% to 2.2% effective July 1, 2026. Federally, the Government of Canada announced $1.5 billion on May 4, 2026 to support tariffed industries, including a new $1 billion Business Development Bank of Canada loan program.
Looking Ahead
Stronger land sales, higher building investment, tightening vacancy and moderating supply point to renewed confidence in well-located industrial land and buildings, although tenants continue to hold some negotiating leverage. Asking rents appear to be approaching a floor.
For further reading: Download the Q2 2026 ICI Land and Industrial Buildings Report (PDF)
This report reflects information available at its release on August 5, 2026.
Thinking about buying or selling ICI land? Speak with our team.