Key Takeaways
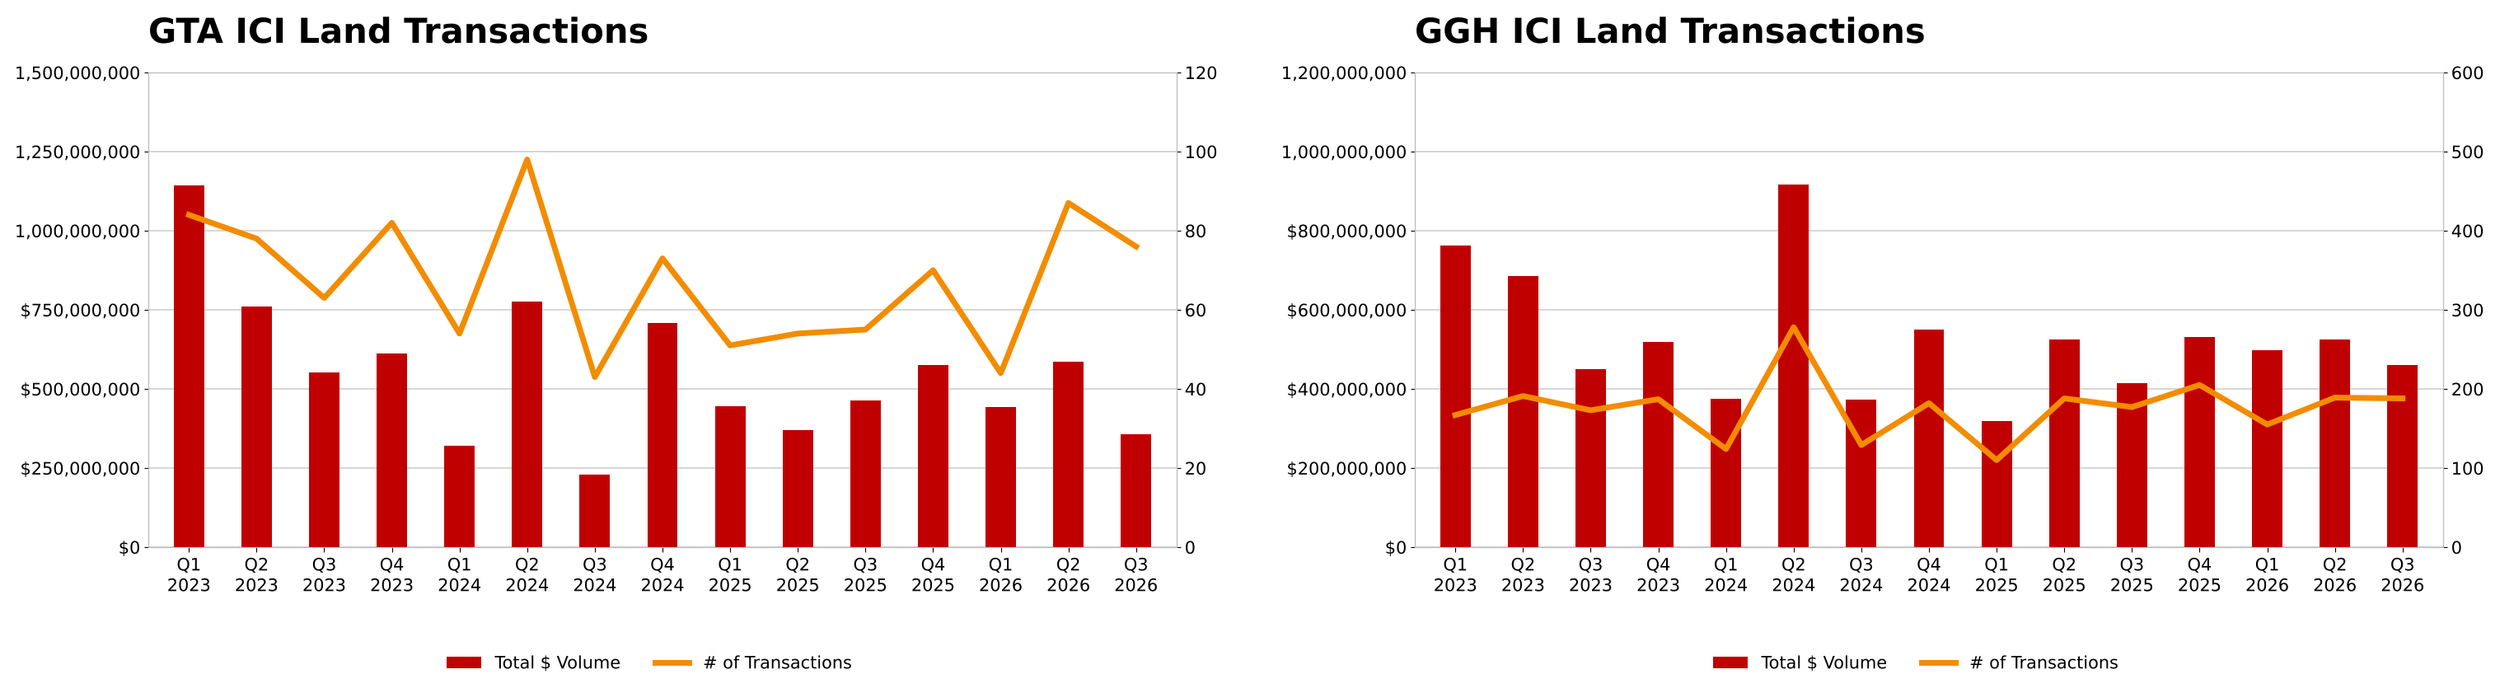
GTA ICI land recorded 76 transactions in Q3 2026, the highest third-quarter count since at least 2023.
GTA ICI land dollar volume eased to $357.3 million, down 39.1 percent from a revised $586.5 million in Q2, as average deal size came down.
GGH ICI land volume was $460.1 million across 188 transactions, up 11 percent from a year earlier.
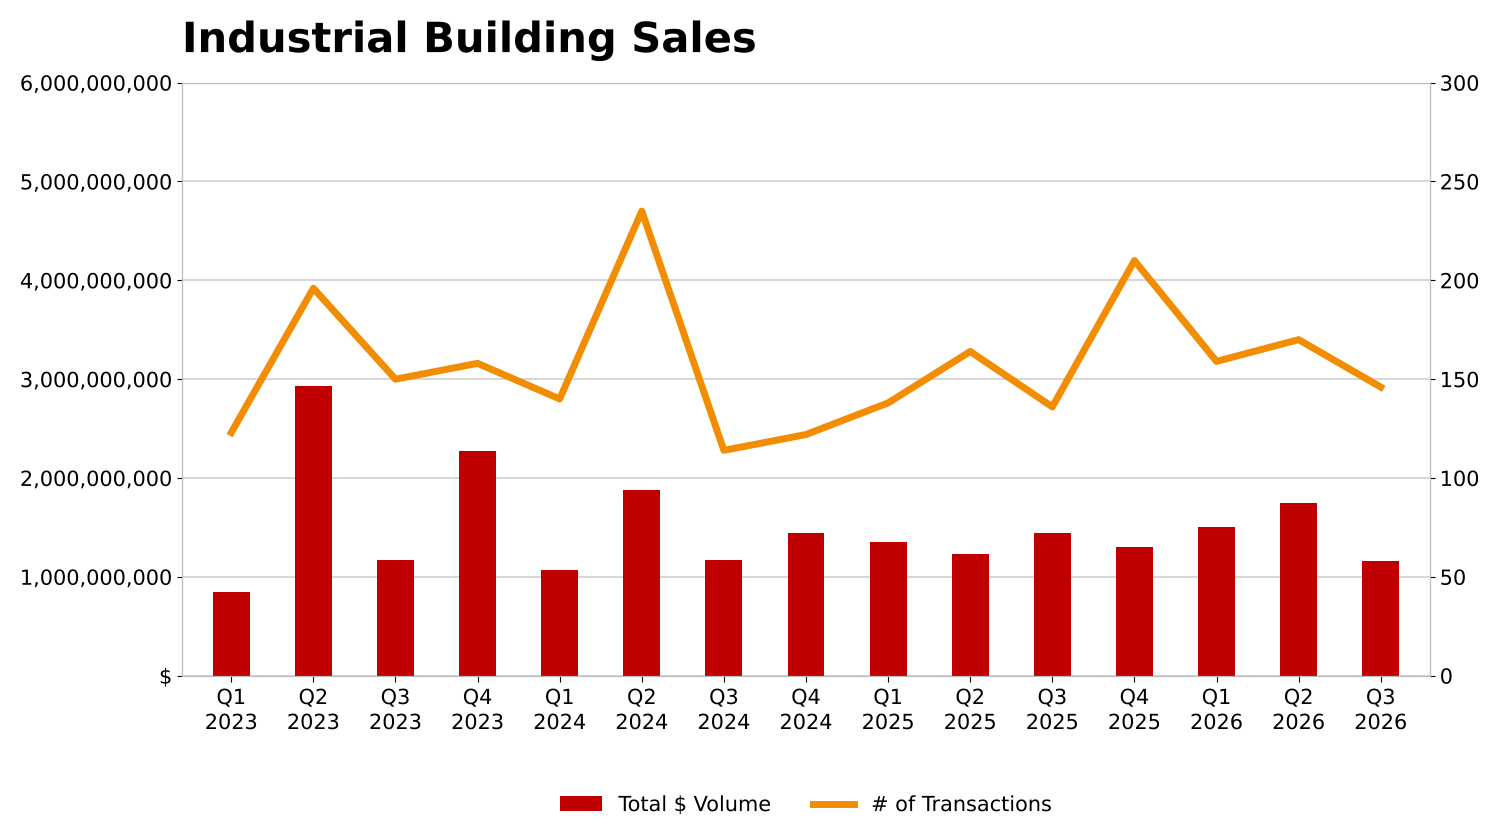
GTA industrial building sales totalled $1.16 billion across 146 transactions, the lowest quarterly total since early 2024.
The Altus-tracked industrial universe recorded a 2.8 percent total vacant rate; the estimated asking rate eased to $16.66 per square foot.
Altus tracks 12.3 million square feet of industrial space under construction, about 63 percent still available.
Market Overview
In our view, the Greater Toronto Area and Greater Golden Horseshoe industrial market spent the third quarter of 2026 consolidating. Land buyers stayed active by deal count but pulled back on deal size, industrial building sales cooled after a two-year high in the spring, and vacancy and rents held within narrow ranges. In our view, after a firmer second quarter, Q3 read as a pause rather than a change in direction.
Regional Trends and Notable Transactions
GTA ICI land recorded 76 transactions in Q3 2026, the highest third-quarter count since at least 2023 and well ahead of the 55 recorded a year earlier. Dollar volume told a different story. Volume eased to $357.3 million, down 39.1 percent from a revised $586.5 million in the second quarter, as average deal size came down. The two largest deals were industrial sites at almost the same price: Salem Road in Ajax at $26.3 million for 17.7 acres, acquired by Menkes Developments, and 8141 Hornby Road in Halton Hills at $26.0 million for 22.4 acres. Caledon led by deal count with 13 transactions, while Halton Hills, Ajax and Caledon led by dollar value. Government buyers completed 12 GTA purchases and private Canadian investors 34. In the GGH, volume eased 12.3 percent from Q2 to $460.1 million across 188 transactions but was up 11 percent from a year earlier, led by a 99.1 acre site in West Gwillimbury and a 20.9 acre industrial parcel in Cambridge.
Market Performance
On the building side, GTA industrial sales totalled $1.16 billion across 146 transactions, down from $1.75 billion in the second quarter and the lowest quarterly total since early 2024. Larger trades still got done: the sale of 750 Creditstone Road and 121 Pippin Road in Vaughan to Zzen Group for $115.0 million led the quarter. Looking past one quarter, CoStar puts Toronto industrial sales at about $5.7 billion over the 12 months to early November, above its 10-year average.
Vacancy and Asking Rates
In our view, fundamentals were steady. The Altus-tracked industrial universe of 964.4 million square feet recorded a total vacant rate of 2.8 percent, up 10 basis points from Q2 but 30 basis points lower than a year ago. The total available lease rate rose to 4.5 percent from 4.3 percent, and the estimated asking rate eased to $16.66 per square foot from $16.92, the lowest level in the series since Q1 2023. The decline was modest, and in our view rents are finding a floor rather than turning.
Supply and Absorption
Supply is the part of the picture to watch. Altus tracks 12.3 million square feet of industrial space under construction across 43 buildings, with about 63 percent of it still available. On the demand side, CoStar records about 10.1 million square feet of positive net absorption in Toronto over the 12 months to early November. In our view, steady absorption should let the market take up new space over time, but the share of available space under construction will keep landlords competitive on rents for new product.
Policy Context
The macro backdrop became more cautious after quarter end. The Bank of Canada held its policy rate at 2.25 percent through the third quarter, then raised it to 2.50 percent on October 28, 2026. It cited higher energy-driven inflation and expects growth to slow in the fourth quarter as new U.S. tariffs take effect. Statistics Canada reported national manufacturing employment down 13,000 in September, while Ontario employment was up 1.1 percent year over year.
Looking Ahead
Looking ahead, we expect buyers to stay active but price-disciplined, especially on larger land positions, as financing costs edge up and trade uncertainty persists. In our view, well-located industrial land and modern, functional buildings remain best positioned.
Frequently Asked Questions (as of Q3 2026)
How many ICI land deals closed in the GTA in Q3 2026?
As of Q3 2026, 76, the highest third-quarter count since at least 2023 and up from 55 a year earlier, according to Altus Group data.
What was GTA ICI land dollar volume in Q3 2026?
As of Q3 2026, $357.3 million, down 39.1 percent from a revised $586.5 million in Q2 2026.
What were the largest GTA ICI land sales in Q3 2026?
Salem Road in Ajax at $26.3 million for 17.7 acres, acquired by Menkes Developments, and 8141 Hornby Road in Halton Hills at $26.0 million for 22.4 acres.
What is the GTA industrial vacancy rate?
As of Q3 2026, the Altus-tracked industrial universe of 964.4 million square feet recorded a total vacant rate of 2.8 percent, up 10 basis points from Q2 and 30 basis points lower than a year earlier.
What are industrial asking rents in the GTA?
As of Q3 2026, the Altus estimated asking rate eased to $16.66 per square foot from $16.92 in Q2, the lowest level in the series since Q1 2023.
What is the outlook for GTA industrial land?
As of Q3 2026, we expect buyers to stay active but price-disciplined, especially on larger land positions, as financing costs edge up and trade uncertainty persists. In our view, well-located industrial land and modern, functional buildings remain best positioned.
For further reading: Download the Q3 2026 ICI Land and Industrial Buildings Report (PDF)
This report reflects information available at its release on November 5, 2026.
Thinking about buying or selling ICI land? Speak with our team.
Prepared by Arash Fatemi, Vice President, Capital Markets, and Renato (Ron) Viele, Senior Vice President, Land & Investment Group, Royal LePage Commercial.